The below model demonstrates the causes and impacts between factors that affect transition to smart local energy systems. The factors information is integrating and aggregating from the case studies of Bristol city, ESO and Reflext.
This model is to be used as an exploration tool to build a better understanding of impact propagation and co-dependencies. It is not for quantification of any kind.
Press Remix then Play to exercise the below model by
increasing/decreasing impact of various factors through arrows in cycled factors
Note: this is only a partial model: only partial information from 3 case studies is integrated to allow for readable presentation and exploration. Thus, it is both:
limited to inputs provided by the qualitative study participants;
limited to the circumstances of the case studies itself.
It is underspecified in terms of the magnitudes of change, as well as in terms of elements and links between them. For example, when multiple loops execute simultaneously, only the length of the link between nodes shows which loop will eventually dominate, which, clearly is not any reflection of reality.
What factors affect transition to smart local energy systems in ESO from the Building and Retrofit Sub-System perspective?
The below model captures the causes and impacts between a set of factors that emerged form the case study of ESO project. This model is to be used as an exploration tool to build a better understanding of impact propagation and co-dependencies. It is not for quantification of any kind.
Press Remix then Play to exercise the below model by
increasing/decreasing impact of various factors through arrows in cycled factors
Note: this is only a partial model; it is based only on the information from a qualitative study of ESO project’s Building and Retrofit sector. Thus, it is both:
limited to inputs provided by the qualitative study participants;
limited to the circumstances of ESO project itself.
It is underspecified in terms of the magnitudes of change, as well as in terms of elements and links between them. For example, when multiple loops execute simultaneously, only the length of the link between nodes shows which loop will eventually dominate, which, clearly is not any reflection of reality.
What factors affect transition to smart local energy systems in ESO from the Local Authorities Sub-System perspective?
The below model captures the causes and impacts between a set of factors that emerged form the case study of ESO project. This model is to be used as an exploration tool to build a better understanding of impact propagation and co-dependencies. It is not for quantification of any kind.
Press Remix then Play to exercise the below model by
increasing/decreasing impact of various factors through arrows in cycled factors
Note: this is only a partial model; it is based only on the information from a qualitative study of ESO project’s Local Authorities sector. Thus, it is both:
limited to inputs provided by the qualitative study participants;
limited to the circumstances of ESO project itself.
It is underspecified in terms of the magnitudes of change, as well as in terms of elements and links between them. For example, when multiple loops execute simultaneously, only the length of the link between nodes shows which loop will eventually dominate, which, clearly is not any reflection of reality.
What factors affect transition to smart local energy systems in ESO from the ICT Sub-System perspective?
The below model captures the causes and impacts between a set of factors that emerged form the case study of ESO project. This model is to be used as an exploration tool to build a better understanding of impact propagation and co-dependencies. It is not for quantification of any kind.
Press Remix then Play to exercise the below model by
increasing/decreasing impact of various factors through arrows in cycled factors
Note: this is only a partial model; it is based only on the information from a qualitative study of ESO project’s ICT sector. Thus, it is both:
limited to inputs provided by the qualitative study participants;
limited to the circumstances of ESO project itself.
It is underspecified in terms of the magnitudes of change, as well as in terms of elements and links between them. For example, when multiple loops execute simultaneously, only the length of the link between nodes shows which loop will eventually dominate, which, clearly is not any reflection of reality.
What factors affect transition to smart local energy systems in ESO from the (Traditional) Energy Sub-System perspective?
The below model captures the causes and impacts between a set of factors that emerged form the case study of ESO project. This model is to be used as an exploration tool to build a better understanding of impact propagation and co-dependencies. It is not for quantification of any kind.
Press Remix then Play to exercise the below model by
increasing/decreasing impact of various factors through arrows in cycled factors
Note: this is only a partial model; it is based only on the information from a qualitative study of ESO project’s (Traditional) Energy sector. Thus, it is both:
limited to inputs provided by the qualitative study participants;
limited to the circumstances of ESO project itself.
It is underspecified in terms of the magnitudes of change, as well as in terms of elements and links between them. For example, when multiple loops execute simultaneously, only the length of the link between nodes shows which loop will eventually dominate, which, clearly is not any reflection of reality.
What factors affect transition to smart local energy systems in ESO from the Transport and Mobility Sub-System perspective?
The below model captures the causes and impacts between a set of factors that emerged form the case study of ESO project. This model is to be used as an exploration tool to build a better understanding of impact propagation and co-dependencies. It is not for quantification of any kind.
Press Remix then Play to exercise the below model by
increasing/decreasing impact of various factors through arrows in cycled factors
Note: this is only a partial model; it is based only on the information from a qualitative study of ESO project’s Transport and Mobility sector. Thus, it is both:
limited to inputs provided by the qualitative study participants;
limited to the circumstances of ESO project itself.
It is underspecified in terms of the magnitudes of change, as well as in terms of elements and links between them. For example, when multiple loops execute simultaneously, only the length of the link between nodes shows which loop will eventually dominate, which, clearly is not any reflection of reality.
A day ago the Faculty of Engineering at the University of Bristol run a discussion panel on if and how should (environmental) sustainability be taught to the Engineering students. Here are my 2 pence on teaching sustainability to Computer Science students.
Why should our students engage with Environmental Sustainability in their formal education?
Well because the ICT/Software impacts and drives every activity in the present society – from the day to day business to entertainment, education, and policy. This impact is felt in two ways:
through production and use of ICT equipment and software, and
through changing the way that the society itself operates.
I will only mention some brief points about the impact of production and use of ICT:
Energy Consumption of the ICT systems seems to be growing unstoppably, e.g.,
In 2018 the data centres were accountable for about 1 % of the global electricity use
The energy consumption of the ICT is projected (in worst case) to account for 20% of the world electricity consumption in 2030 [1].
Materials, including rare earth metals are also increasingly depleted for use of ICT hardware production. Even worth, as much of the hardware is quickly outdates and distracted, it creates the problem of e-waste.
Waste form ICT hardware is either put into landfill or damped at the developing countries.
So yes, to point out a few issues that we, as computer scientists and engineers we need to learn to think about: how about teaching and learning about how to minimise energy and material consumption, how to design modular and long-living hardware and software solutions, how to make our software maintainable and hardware bio-degradable?
But, even more importantly, Software Engineers must learn about the impact that their software solutions have within their situated environments.
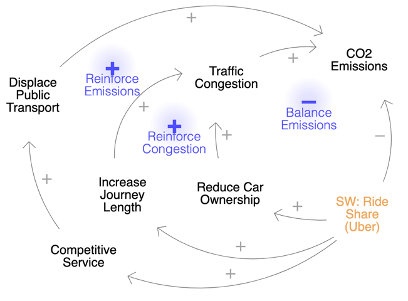
Let’s look at the problem of traffic congestion: we all know that when too many vehicles are trying to get through a given road, they create a traffic jam; as the vehicles use (fossil) fuels while sitting in a traffic jam, they ends up generating excessive CO2. So what can a software engineer do to help? How about we some ride sharing software solutions, like Uber or Lyft? We know that, as shown in Figure 1,
Figure 1: Ride sharing software to reduce CO2 emissions.
this software will reduce the need for car ownership and as lesser number of people own and drive their cars, it will also reduce traffic congestion problem!
We already teach our students how to develop such applications. They already learn about platform development for data collection, and data analytics, distributed systems development and could computing and user interface design: all that they need to develop a ride sharing application is well covered in the current Computer Science curriculum.
But what happens once this application goes out to be used by people? It turns out that car ownership does decrease, so great. But, as studies into ride sharing show, these also increase the distance travelled by the shared cars. Even worse, as ride sharers become accustomed to the Uber/Lyft services, which are convenient and cheap compared to “normal” taxies, they start to substitute the journeys previously taken by public transport (i.e., bus or train) for ride sharing services.
In short, traffic congestion and respective CO2 emissions do not improve at all, as shown in Figure 2.
Figure 2: Longer term environmental impact from use of ride sharing.
I suggest this is because, while the software developers for the ride sharing solutions may have wished to reduce environmental impact, they did not know how to account for such an impact. As and education providers, we do not teach out Software Engineering students about:
Systems Thinking,
Environmental Life Cycle Assessment,
Responsible Innovation and Software Impact Assessment, about
Human Behaviour and Rationality, or
Sustainable Living.
What should be offered to students within our faculty wrt Environmental Sustainability?
Well, all of the above. Unless we teach our students to account for the human behaviour and longer term software use, software impact assessment and responsible decision making in what, how, and why is integrated into software solutions, we are not likely to see such solutions having any positive impact in addressing the challenges of the environmental degradation and climate change.
So how can we integrating Sustainability into our programs?
I suggest that each module taught to our students must cover content of how it relates to sustainability and sustainable development. So each module needs to be reviewed. As stated in the Karlskrona Manifesto for Sustainability Design [2,3]:
“There is a perception that sustainability is a distinct discipline of research and practice with a few defined connections to software.
Whereas sustainability is a pervasive concern that translates into discipline- specific questions in each area.”
So, we really do need to teach students about which questions does sustainability translate in each of our modules, and how to address these questions, some examples of these are shown in Fig 3.
Figure 3: Additional issues to consider in Computer Science Curricula.
[3] Becker, C., Chitchyan, R., Duboc, L., Easterbrook, S., Penzenstadler, B., Seyff, N., Venters, C. C. (2015). Sustainability design and software: The Karlskrona manifesto. ICSE’15: 37th International Conference on Software Engineering. http://dx.doi.org/10.1109/ICSE.2015.179
Why is Transition to zero carbon energy challenging?
Transition to zero carbon energy is a complex task because change must be realised throughout all aspects of our society, yet, to name a few challenges:
These aspects are Independently owned, managed and operated: e.g., building and retrofit activates are undertaken by small independent companies and property owners, bus or delivery companies manage their own fleets, etc. While they all draw from and can also feed into electricity grid, each of these companies is managed for their own profit or other goals by independent management bodies.
Changes pertain to re-design and replacement of the established hardware and software infrastructures as well as human behaviours, e.g.,
Replacing each petrol station with EV charge points or biofuel points, gas boilers in each home with heat pumps, setting up telecommunication networks for data collection and analysis from energy generation and consumption equipment then developing algorithms to analyse this data and optimise energy use.
Engaging each household and business, e.g., explaining to each driver why they should allow their EV’s battery to be controlled by some service provider and how to protect their privacy and security in this new energy systems.
Not only is the scale the necessary change massive, but the pace is even more challenging if the 2050 climate objectives are to be met.
These challenges cannot be addressed without coordination, planning, and cooperation.
Why should the transition be planned?
While part of the social and economic activities are perceived to be independent (as per operational, ownership and managerial independence noted above), in truth they are inter-dependant, particularly when change is concerned, due to:
Physical hardware limitations: installations of charge points for EVs or heat pumps to a new built housing area will only be functional only if the local electricity distribution network has the capacity to support them without causing blackouts. Thus, change of physical infrastructure must be coordinated: e.g., undertaking new charge point installations after or alongside of distribution network reinforcement.
Behaviour change in people: e.g., installation of charge points for EVs will not, by itself, ensure transition to electric vehicles. This must be accompanied by a set of educational activities, as well as policy, regulatory and economic support activities. Which include, e.g.,
explaining the need for replacing once’s petrol-fuelled car with EV,
regulating (like clean air zones and pollution charges) to make use of fossil cars less convenient than that of EVs,
providing financial opportunities for either purchasing and EV car to replace the petrol alternatives, or finding a different transportation option (e.g., electric bike with safe biking routes, car share schemes, etc.).
Availability of skilled professionals: without workforce to deliver the change, even the best-intended initiatives are doomed to failure. This was illustrated by the recent the green deal, where funding for retrofit was made available without trained retrofit specialists. This ended in poor quality of retrofit delivery, which led to deep mistrust in homeowners towards both the retrofit as a concept and building/ retrofit providers as a group, resulting in failure of improving energy efficiency and uptake of retrofit as well. Thus, skills for delivery must be developed in tandem with the need for this skills.
Equitable transition: as demonstrated by the closing down of UK’s coal industry by M. Thatcher, changing energy system is bound to lead to need for upskilling and re-skilling. For instance, while replacing gas boilers will require a skilled gas boiler professionals to de-commission these boilers, the need for this specific skill will seize thereafter. Thus, upskilling and re-training must be provided in tandem with transition process as well.
How should the transition be planned?
Plan for Locality: clean energy systems are, by necessity, local (as local renewable sources need to be used for clear energy generation), thus, each plan needs to be local (i.e., defined for a clearly geographically bound area). Given the specificities of each locality, the best plans for each locality will also be specific (e.g., for Bristol one can combine local wind and solar energy generation with biogas supply from outside while expanding hydro-generation on Avon river?).
Plan for a Common Goal: to instigate transition within and across all sub-sectors of social and economic activates, the goals and pace of the transition need to be agreed upon by all players within these sub-sectors. Thus, the businesses from across different sectors, as well as local government, citizen groups, charitable organisations need to agree on the set goals, tasks and timescales for transition. While common goal would be agreed upon by all, the specific tasks and timescales can be agreed upon on a smaller group level (e.g., community energy groups can negotiate with EV charge point providers directly, etc.).
Plan with Stakeholders: while the common goals can be agreed, their delivery will likely need support and cooperation between stakeholders. Thus, challenge-focused working groups should be set up to support stakeholders within and across various sectors in working towards the transition goals (e.g., to transition to zero-carbon building practices new supply chains are necessary for new building materials these can be set up for the whole set of SME building companies together).
What factors affect transition to smart local energy systems in Bristol from the (Traditional) Energy Sub-System perspective?
The below model captures the causes and impacts between a set of factors that emerged form the case study of Bristol city. This model is to be used as an exploration tool to build a better understanding of impact propagation and co-dependencies. It is not for quantification of any kind.
Press Remix then Play to exercise the below model by
increasing/decreasing impact of various factors through arrows in cycled factors
Note: this is only a partial model; it is based only on the information from a qualitative study of Bristol’s local authority. Thus, it is both:
limited to inputs provided by the qualitative study participants;
limited to the circumstances of Bristol itself.
It is underspecified in terms of the magnitudes of change, as well as in terms of elements and links between them. For example, when multiple loops execute simultaneously, only the length of the link between nodes shows which loop will eventually dominate, which, clearly is not any reflection of reality.